

Yield predictions for Jatropha.
Until recent, most studies, business plans and articles were stating that Jatropha plants will reach maturity around year 5 and because there were no reliable data, it almost became a fact.
Recently the evidence is growing that the moment of Jatropha reaching maturity is much more variable, depending on lots of environmental factors like soil and rain and temperature and probably on gene characteristics as well.
This makes it very difficult to predict volume and time of yield, which is, however, essential for creating a reliable business plan.
On the site from the Fact/ADPP Project (https://sites.google.com/site/mozambiquejatropha/research-program/research-activities/06-jatropha-yield-forecasting-1),Flemming Nielsen did an attempt to make a Jatropha Yield Forecasting model. He used of course the experience of the project in Mozambique and tested that with the help of earlier published yield data. ( These data were among others published by Achten et al 2008, , Heller J. 1996, Foidl N et al 1996, Matsuno et al 1985)
His model predicts the highest yield in year 9 and shows a growth model following an S, (Richards curve.)
Discussion
Although the model might be right, the data on which it is used are questionable especially at the beginning and the end of the data range, crucial for the formation of an S curve.
- Rain is not measured; it is estimated or average data. Although not crucial for the yield prediction, it makes one wonder whether the other data used is measured data, average data or calculated data.
- Nicaragua yield jumps from 0 to 2327 kg.per ha in year 2. So crucial data from the first year are missing.
- Paraguay yield starts with 100kg collected in year 3, which makes one wonder what happened in year 1 and 2. Further on it is striking that after year 4 there is a yearly yield increase of exactly 1000 kg per year, until year 8 after which yield increase stops abruptly. The only thing one can conclude here is that these figures are not measured but rounded of or calculated.
Below I gathered the most reliable data both from publications and from verbal communications and own experience, to justify the yield prediction used in the Max Havelaar Fairtrade Jatropha feasibility study.
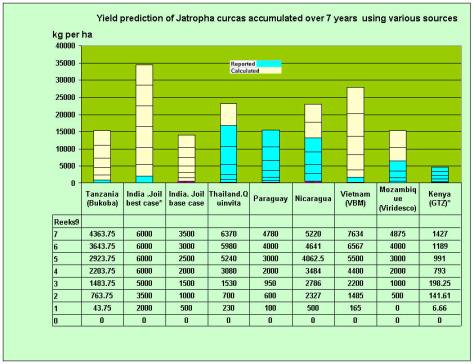
Although the original data from Paraguay are the longest recorded data, they do not make sense. It is against nature that Jatropha has an increase in yield up to 4000 kg and than abruptly stops increasing. So I added the average yearly yield increase to the yield of year 8 to get a figure 4780 for year 9.
Further on it does not take 3 growing seasons in Paraguay for Jatropha before it produces 100 kg of seeds. So I skipped the 2 years with 0 yields for the graph in a sense that the plants start to produce after the 1e year.
As a consequence my graph is covering 7 years in stead of 9 years.
- JOIL claims to yield 2000 kg in the first year (newly selected Jatropha with fertilizer and additional irrigation) All the other data are calculated.
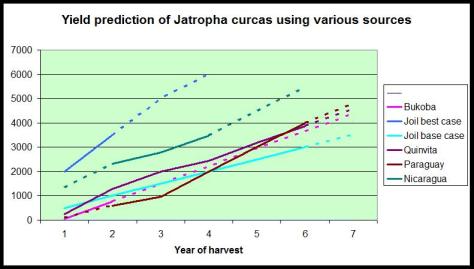
- Quinvita is the only company providing measured data over a period of 6 years. The conditions of that trial are also pretty close to Bukoba conditions
These data are giving the following graph, showing that Jatropha yield increase is pretty linear.
Conclusion. Not the yields in the feasibility study have to be changed, but the period over which those yields are being reached.
